
Getting started
The dashboard: reading my figures
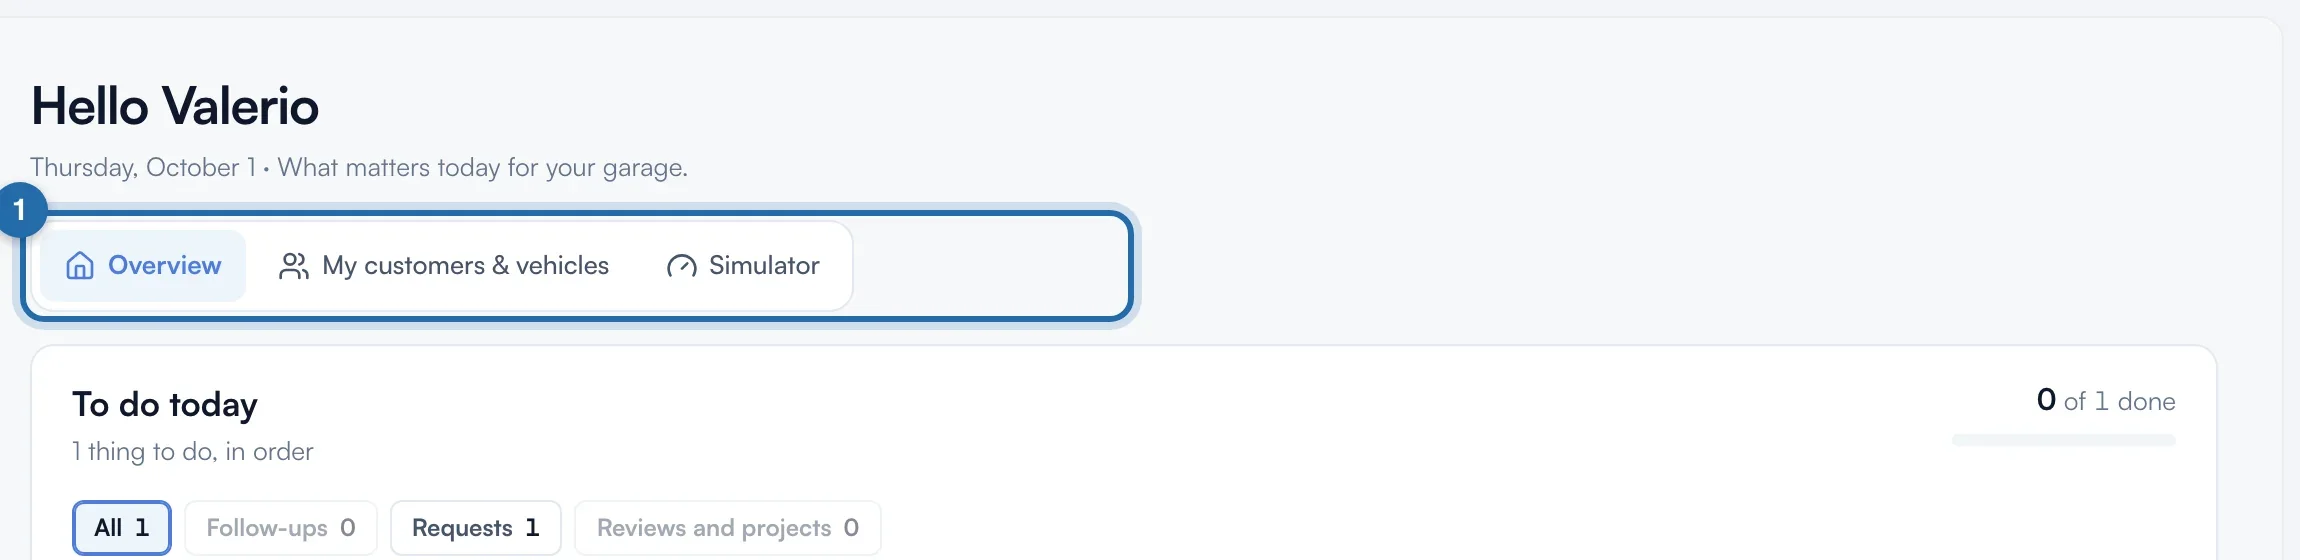
"Overview" shows what matters today, in four tabs: activity, customers, revenue and simulator.
Before you start
- All figures are real, read from your account. Comparisons in % are against the previous period of the same length.
Open the dashboard
Click "Overview", at the top of the menu. The tabs are at the top: "Overview", "My customers & vehicles", "Revenue" and "Simulator". On a phone, they are in a drop-down list.
Read the four cards
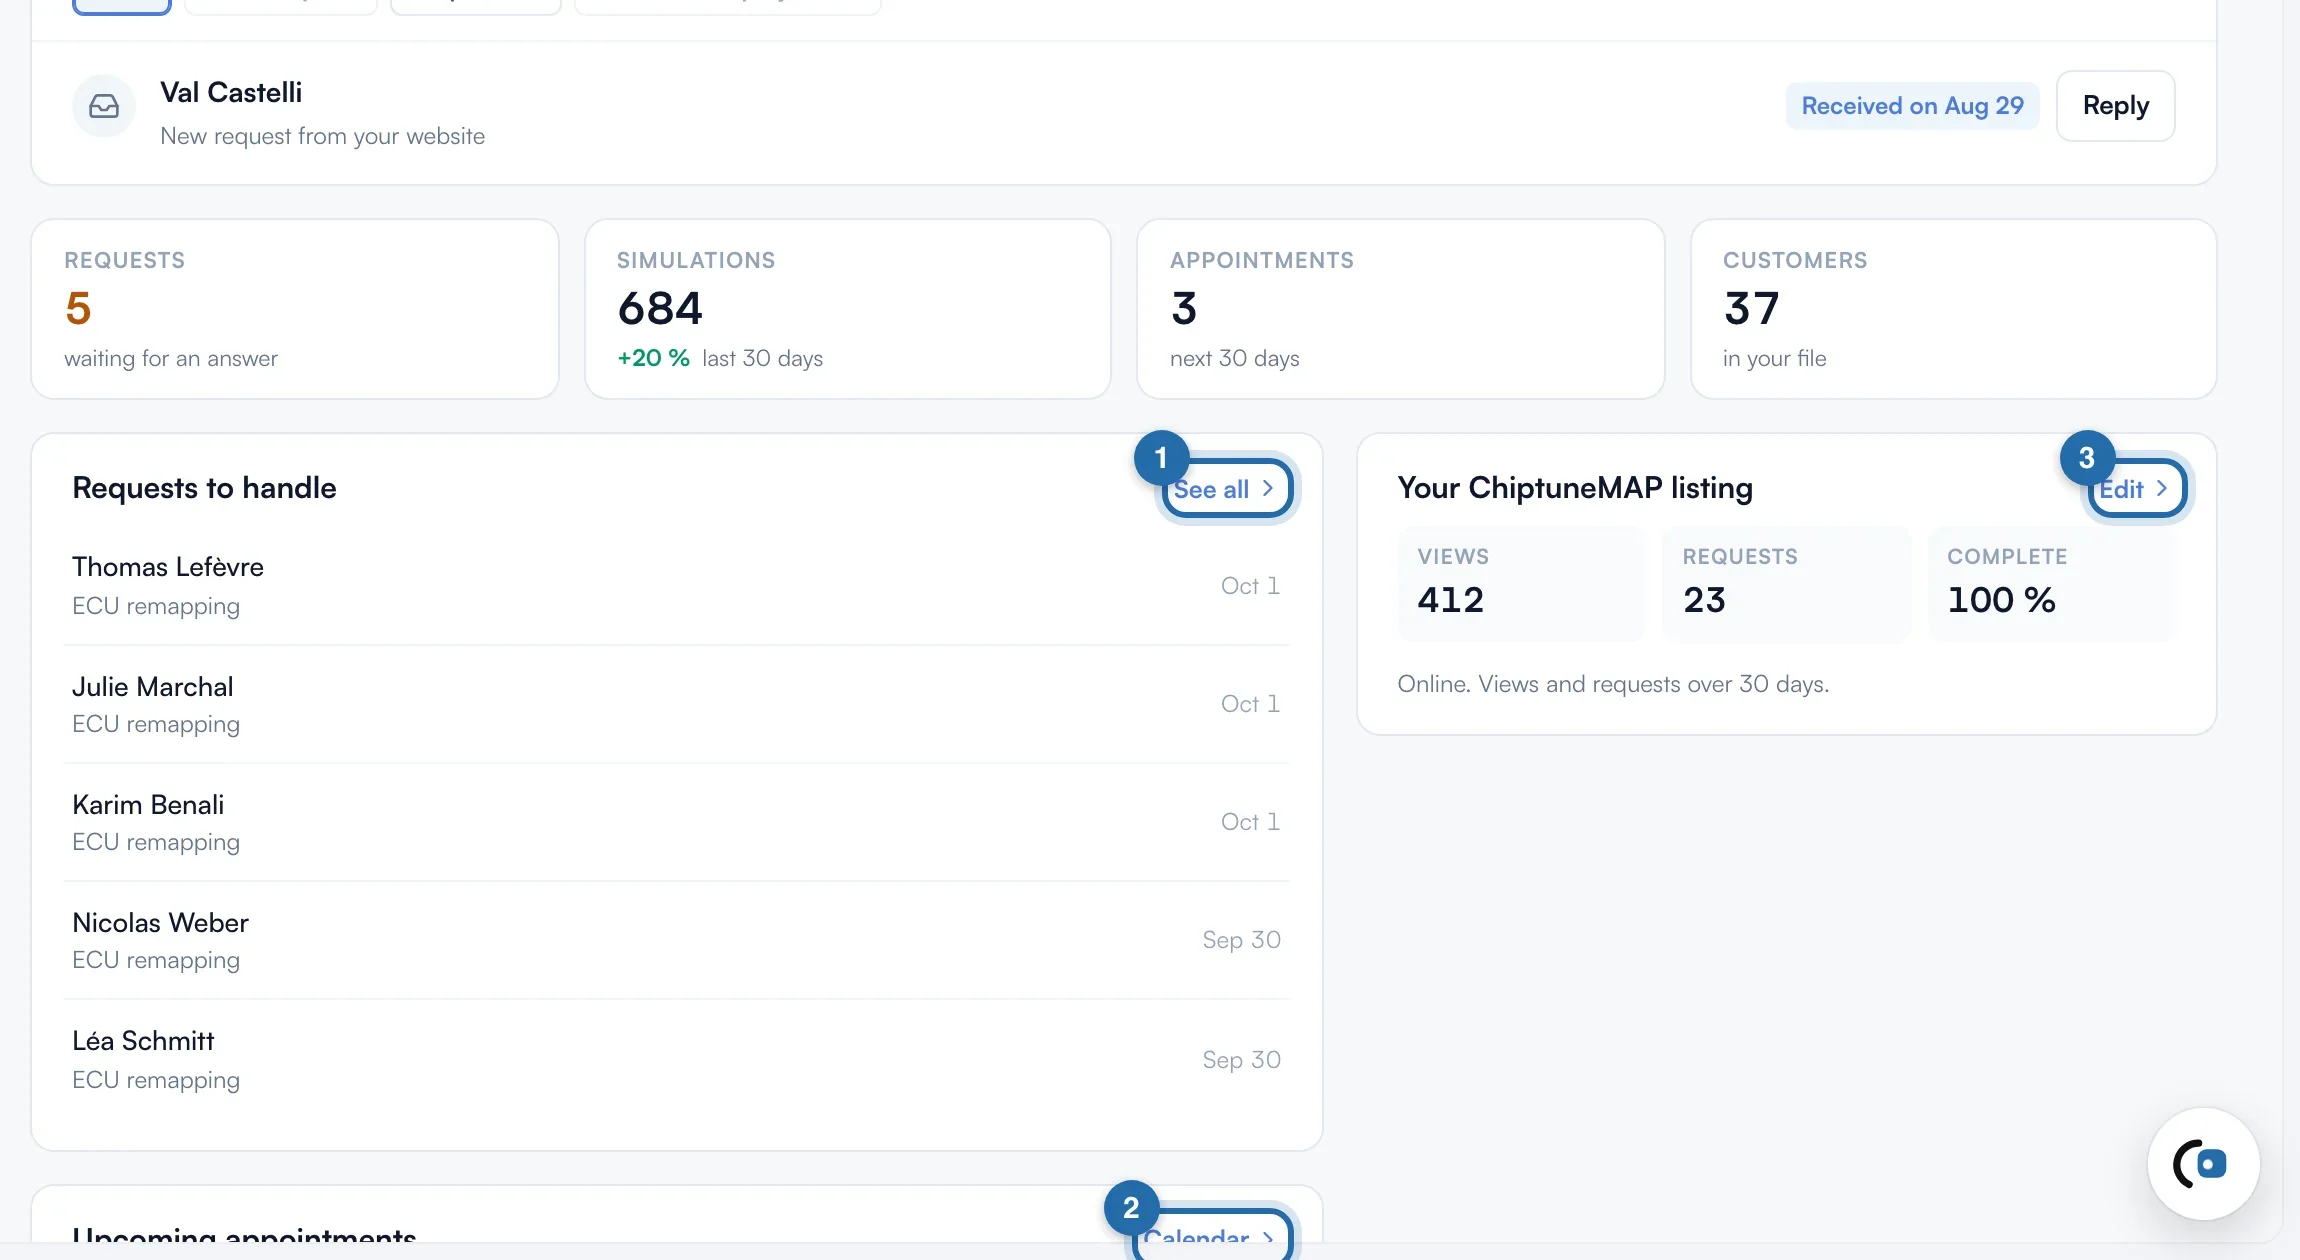
"Requests": waiting for a reply, in orange if there are any. "Simulations": over the last 30 days, with the change in %. "Appointments": the next 30 days. "Customers": the total in your database. Clicking a card opens the matching page.
Handle what comes next
"Requests to handle" lists the last 5 pending requests, and "See all" opens "Requests". "Upcoming appointments" lists the next 5, and "Calendar" opens the calendar. "Your ChiptuneMAP listing" gives views, requests over 30 days and completion rate; "Edit" opens the listing.
My customers & vehicles
Four cards: "Customers", "Vehicles", "Remapped" (vehicles with a power after) and "This month" (vehicles added). Below, "Latest customers" and the "Vehicles added per month" chart over 12 months.

Revenue
"Collected" this month compared with last month, "To collect" (sent invoices not paid), "Overdue" and "Pending quotes". "Collected per month" counts paid invoices on their payment date, over 12 months. "Invoices to chase" and "Quotes without an answer" list the documents to follow up. This tab is for France only.
Simulator
"Simulations" and "Requests" over 30 days with their change, "Visitors" (unique each day) and "Contact clicks" on your phone or email. Below: "Simulations per day", "Where simulations come from" ("Your website", "ChiptuneMAP", "Module or API"), then the most simulated vehicles and makes.

If it doesn't work
- I only see the next step of the guide.
- On a new account, with no request, appointment, customer or simulation, the dashboard only shows the next "Quick start" step. Click "Show the full dashboard".
- The "Simulations" card shows a dot.
- Without a subscription, simulator statistics are not calculated. The card leads to the simulator settings, and the "Simulator" tab shows the state of your discovery.
- I don't have the "Revenue" tab.
- It only appears for companies based in France, like quotes and invoices.
- A "Your ChiptuneMAP listing is ready" box shows at the top.
- Your listing is filled in but not published. Click "Publish my listing" to appear on the map.